|
20090317. Belatedly noted, 200901-02-03 predict below average, with end months in 2009 above average
20080509. Last half 2008 predicts to be lower
precipitation than average.
20050107. Lower than average precipitation during November and December 2004 followed moderately above average precipitation September-October.
A strong 4 year cycle evidenced in recent years prompts pattern comparisons of October, November, December for 2000 (5.89, 4.68, 6.25) and 2004 (7.06, 4.74, 9.67) relative to 1971-2000 monthly averages (5.07, 11.23,
12.14). So far in 2004-05 rainy season, precipitation levels for non-Coastal Oregon have fared slightly higher than this Coastal division. This model's longer term dynamics (Whole) predicted lower
precipitation for months 1,2,3 in 2005 but basically average in fall 2004. An experimental model (results unpublished) with input data ending 200308 predicted well through 200411 but lower by several inches
for 200412, and predicts above average for 200501-02-03. Without trying to resolve differences here between the two model approaches or predicted results, Oregon CD01 appears to experience fall 2004
patterns similar in some ways to 2000-01 or 1976-77, two periods of problematic low precipitation.
20030417. Oregon Climate Division #1 (Coastal) has experienced lower than average precipitation since the spring of 2000. The most dramatic and
consequential event was the dry winter of 2000-01 when the primary wet months of November-March received 46% of the previous 30 year's average. Interior Pacific Northwest areas experienced similar decline in
precipitation with large adverse impacts.
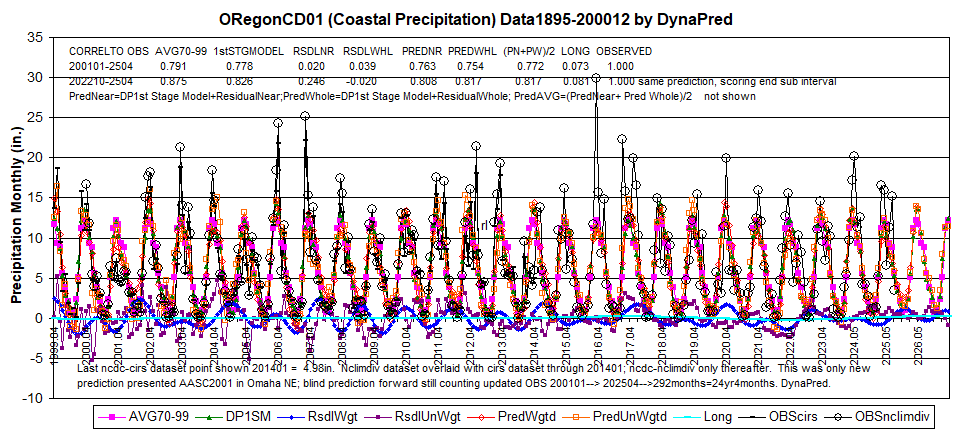
DynaPred's Detailed Model Prediction beginning January 2001 illustrates the complex interaction of longer-term climate dynamics
and shorter-term dynamics. The relatively dry tone since spring 2000 reflects more the nearby climate dynamics during 2001 and 2002. Winter 2001-02 illustrated well how long-term dynamics and short-term dynamics can
combine to generate the observed November-January precipitation pattern.
The continued dry undertone from nearby dynamics is expected to continue through 2003 with long term dynamics also being below
average through late summer before both start to move upward through end of 2003. Even then, the long term dynamics outlook is wetter than average and the short term dynamics component is below average but
importantly trending up as illustrated by the respective Residuals in the chart.
A similar chart with prediction beginning 200102 was presented at the AASC Annual Meeting in August 2001. An error was soon
discovered that was not present in this 200101 beginning prediction, and the latter chart has since been shown on several occasions. The above chart was shown December 7 at the AGU Fall 2002 meeting Hydrology
section (H-61)on Drought Prediction in the context of illustrating the climate dynamics at work.
As mentioned in the About. . .Methods section of this website, for Oregon Climate Division I precipitation the key climate
contributions occur in ways associated with the Chandler Wobble near 15 months and the Quasi-Triennial Oscillation (QTO) between 36 and 48 months.
|
