|
Monthly Featured Chart:
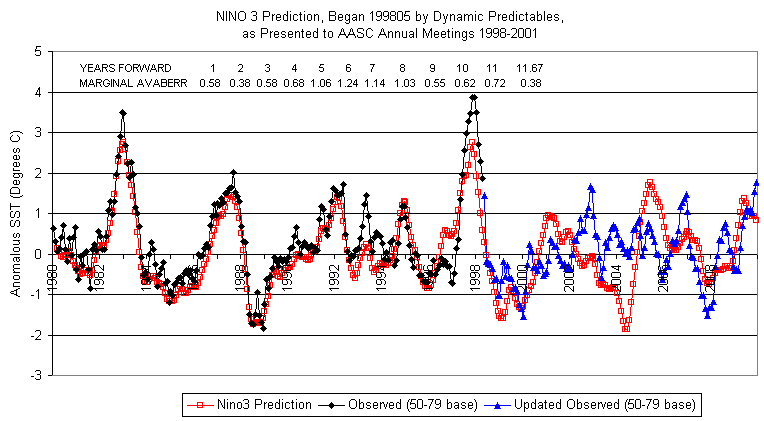
20100114. Retirement: DynaPred's first published chart as presented at AASC1998 Annual Meeting in Duluth, Minnesota, was presented and evaluated through 140
months (11.67 years) from 199805-200912. As noted a computation error was discovered and corrected in 2003 after 5 years. Note:
1. The Observed Anomaly Standard Deviation over the 140 months was 0.71 C. AvAbsErr was 0.76C.
2. First 4 years were good, second four years not-so-good, last 3.67 years
were good.
3. Beginning year 5 although amplitudes were often problematic, the max/min turning percentage topped 75%.
|
