|
|
|
|
|||||||||||||||||||
|
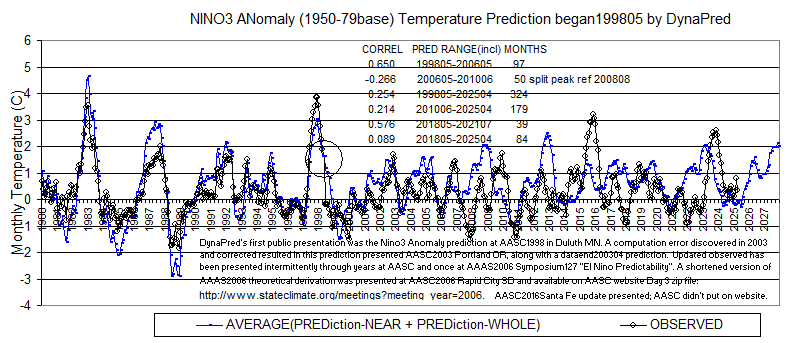
20180730. See same three Nino predictions updated through 201805--link at bottom. 20170726. See three Nino3 Predictions from 1993, 1998, 2003 stacked at page bottom. |
 |
|
20210127. Same prediction, display extended through 202412. |
|||||
|
20151127. "El Nino Predictability", a short name and version from the AAAS2006 Symposium#127 in St Louis Missouri, was presented in even shorter form
at AASC2006 Annual Meeting in Rapid City South Dakota. Presentation included empirical and theoretical underpinnings of DynaPred's methods. The AASC PPT is found in : Day 3 zip file:
http://www.stateclimate.org/meetings?meeting_year=2006 |
|||||
|
20140618.Last NOAA/NWS/CPC data point shown: 201405. Note interval 200605-1006 negative correlation may be seen as due to peak splitting with observed central peak lower than predicted and smaller side peaks increasing higher while occurring at/near dates of predicted minor peaks. Also note overall average temperature for interval decreased by 0.35-0.50C and appears to be continuing with subsequent lower observed than predicted. Correlation since 201006 has been in vicinity of 0.70 which is higher than the 0.65 correlation for first eight years. |
|||||
|
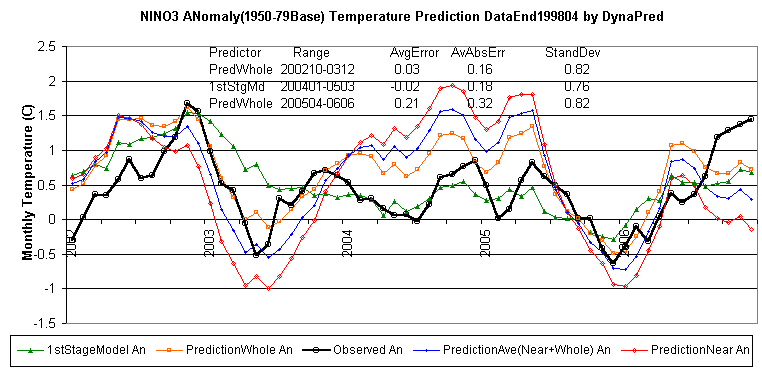
The 2003 software error corrected prediction as first presented at AASC2003 Annual Meeting in Portland, Oregon. The 2002-2006 prediction range breakout with underlying model detail is presented as a GIF file immediately below and with discussion beginning 19 inches down on the parent El Nino page. Note Average Error and Average Absolute Error levels achieved over consecutive 15 month ranges with the two predictors. |
|||||
 |
|||||
|
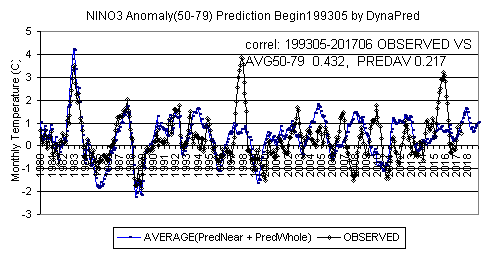
NINO3 Prediction Began 200305, below, with same model settings as above began 199805. Observations updated through 201307 and usually updated around 10th of following month. |
 |

