|
|
|
|
||||||||||||||||||
|
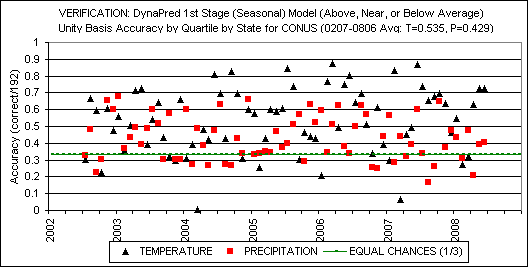
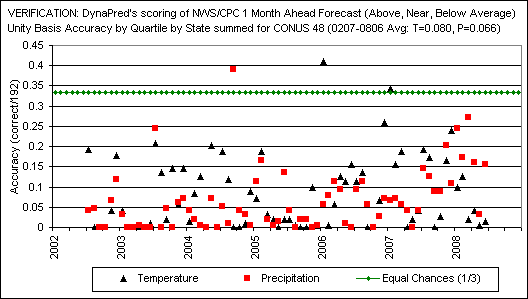
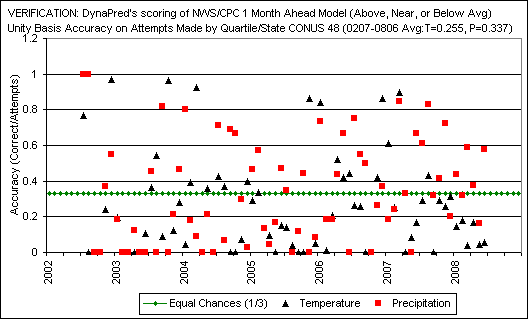
20080729. After 72 months or six years, the corresponding statements from below still apply. DynaPred's predictions through 200806 are at 66 months and counting from January 2003. End 20080729 comment. 20070714. After five years (60 months 200207-200706) the corresponding statements still hold. Charts below and downloadable DOC file display the three stacked Verification charts. End 20070714 comment. 20050129. As used for the continental US, the DynaPred First Stage Model's basic graphic presentation unit was the NCDC climate division (range 3-10 per state) and CPC's basic graphic presentation unit was a US state (48 total), a quartile state evaluation procedure was devised. Then precipitation and temperature accuracy performance on a 0-100 percentile scale was evaluated for the total 48 x 4 = 192 quartile units in the continental US. With three predicted and observed categories, breakeven value or what NWS/CPC calls Equal Chances (EC) meaning effectively 'no prediction' is 1/3 or 0.333. Scoring: Each state was weighted equally and divided up into 4 approximately equal area divisions. Then the respective performance evaluations were made based upon achieved three-category accuracy Above Average, Near Average, or Below Average in each of the 4 divisions within each state. Dynamic Predictables 1st stage model predictions missed by two categories considerably less frequently than CPC, although for brevity, that significant characteristic is not detailed on the following charts. Climate Prediction Center's nearby '90' predictions may be viewed by going to the following URL: http://www.cpc.ncep.noaa.gov/products/predictions/90day/ with others including '30' day nearby. Temperature and precipitation accuracy based upon this scoring method are presented on single charts beginning 200207 when DynaPred began prior month releases. These scorings will be updated from time to time. DynaPred's 1st Stage Model predictions as scored 200207-200412 were all made in 2002. The NWS/CPC predictions were made and released mid-month prior to the scored month. In other words, DynaPred's predictions were made in advance anywhere from 1 to 27 months and counting; NWS/CPC's were made 1 month in advance. End 20050129 comment. Clarification: DynaPred's underlying numbers generating the 3-classifier charts are genrallyavailable to customers for further quantitative work and pattern analysis. The three stacked charts are: |
 |
|
 |
|
 |
|
|
Meaning: DynaPred's 1st Stage Model predicted temperature and precipitation scored better than breakeven over 72 months at 112/144 (7/9 or 0.7778 unity basis or 77.78%). The 200806 scored prediction was made during 200301 with data ending 200212, i.e., 66 months ahead. Using the same scoring, NWS/CPC predicting one month ahead at a time scored 3/144 (1/48 or 0.0208 unity basis or 2.08%). CPC Correct/Attempted scoring was 54/144 above 1/3 breakeven. DynaPred trends over 6 years: temperature sideways to slightly up, precipitation sideways to slightly down. DynaPred's 1st Stage Model scatter increased slightly over the 72 months. CPC has improved precipitation and temperatures prediction skill from about 200601 by this improvised scoring method. Significance: DynaPred's 1st Stage NCDC Climate Division specific predictions in aggregate may be seen as reasonably reliable as demonstrated by their accuracy and low scatter
over the near term (~6 years in advance and counting). More generally, these climate measures may be seen as reasonably well behaved at monthly time steps and relatively compact regions. Even more
generally, US climate of late may be said to be reasonably well behaved by these measures when treated by certain replicable methods. Upshot: If accuracy is more important than being official and if you are free to choose then DynaPred's products may be more useful to you for some purposes. |
|
The same three GIF charts embedded into a single sheet MSWord2000 DOC may be downloaded by clicking: VERIF_DP1SM_NWS_72mTP (40kb). |
