DYNAMIC PREDICTABLES

Dynamic Predictables LLC,  Columbia, MO 65205-1365, USA       dynapred@dynapred.com   t/f +1.573.815.0520                         multi-year, site-specific and regional climate prediction  

DP Home
ATLAS
What's New
Services
About
 Predictions
Archives
Support
Feedback
Links
Disclaimer

Customer Support               current updated climate division data: thru  201105

Please contact us directly if difficulty is encountered updating observations on site-specific, regional and special custom aggregations:

Dynamic Predictables, LLC        tele +1-573-815-0520 
POB 1365
Columbia, MO 65205-1365
USA                                        e-mail: 
support@dynapred.com
 

1. Observed Data updates
(Dynamic Predictables expresses appreciation and recognizes the contributions to public service that come from public agencies at federal, state, and local levels as well as the many private companies that help advance weather and climate service to the benefit of all. A special thanks goes to the US Department of Commerce and NOAA through its many agencies. At different points in this section, we attempt to credit, we hope appropriately and adequately, specific sources in proper context.)

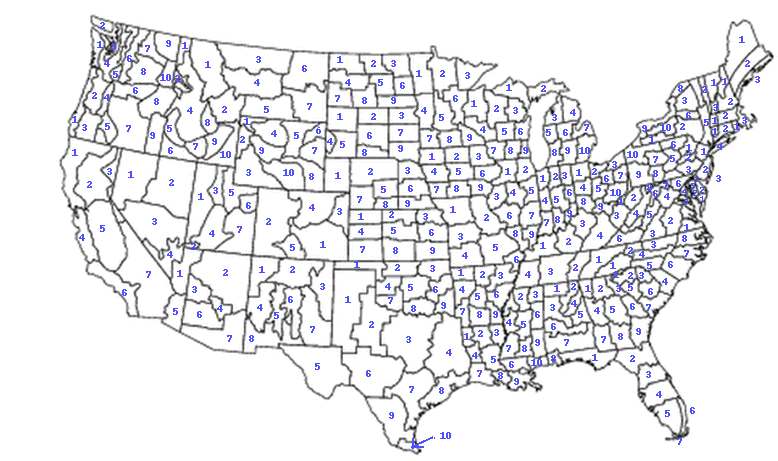
     National Climatic Data Center (NCDC) Climate Division (cirs) data is updated within the first 10 days of the following month. This monthly climate data listing accumulated precipitation and monthly mean temperature may be accessed directly from NCDC, a division of NOAA in the US Department of Commerce. For convenience we provide the most recent data here for each of the 344 climate divisions in the continental US. The original ASCII (plain text) data files from NCDC begin January 1895 and are each approximately 3.5Mb files. This monthly climate division "cirs" data firms in three steps: the first step as reported here within the first ten days of the current month, a second step reporting usually within the last ten days of the current month, and a third step and usually final firming that occurs five to six months later.

     At NCDC, Climate Divisions of interest may be located with a combined numeric state code, climate division number, and climate variable code: StCdV with SS ranging from 1 to 48, Cd ranging from 1 to 10, and V being 1 for precipitation and 2 for temperature.

A crossover table (in Courier New font) is provided relating the state name to the state code:

USA NCDC AND FIPS STATE NUMBERS, CLIMATE DIVISIONS PER STATE

NCDC FIPS STATE             FIPS OTHER  NUMBER
STATE ALPHA NAME             NUMER ABBR.  of NCDC
#    CODE                   CODE USED   DIVISIONS
 1   AL   Alabama            1   ALA    8  
 2   AZ   Arizona            4   ARIZ   7  
 3   AR   Arkansas           5   ARK    9  
 4   CA   California         6   CALI   7  
 5   CO   Colorado           8   COLO   5  
 6   CT   Connecticut        9   CONN   3  
 7   DE   Delaware         10   DEL    2  
 8   FL   Florida          12   FLA    7  
 9   GA   Georgia          13   GA     9  
10   ID   Idaho            16   IDA  10  
11   IL   Illinois         17   ILL    9  
12   IN   Indiana          18   IND    9  
13   IA   Iowa             19   IOWA   9  
14   KS   Kansas           20   KANS   9  
15   KY   Kentucky         21   KY     4  
16   LA   Louisiana        22   LA     9  
17   ME   Maine            23   MAIN   3  
18   MD   Maryland         24   MD     8  
19   MA   Massachusetts    25   MASS   3  
20   MI   Michigan         26   MICH 10  
21   MN   Minnesota        27   MINN   9  
22   MS   Mississippi      28   MISS 10  
23   MO   Missouri         29   MO     6  
24   MT   Montana          30   MONT   7  
25   NE   Nebraska         31   NEBR   8  
26   NV   Nevada           32   NEV    4  
27   NH   New Hampshire    33   N H    2  
28   NJ   New Jersey       34   N J    3  
29   NM   New Mexico       35   N MX   8  
30   NY   New York         36   N Y  10  
31   NC   North Carolina   37   N C    8  
32   ND   North Dakota     38   N D    9  
33   OH   Ohio             39   OHIO 10  
34   OK   Oklahoma         40   OKLA   9  
35   OR   Oregon           41   OREG   9  
36   PA   Pennsylvania     42   PA   10  
37   RI   Rhode Island     44   R I    1  
38   SC   South Carolina   45   S C    7  
39   SD   South Dakota     46   S D    9  
40   TN   Tennessee        47   TENN   4  
41   TX   Texas            48   TEX  10  
42   UT   Utah             49   UTAH   7  
43   VT   Vermont          50   VT     3  
44   VA   Virginia         51   VA     6  
45   WA   Washington       53   WASH 10  
46   WV   West Virginia    54   W VA   6  
47   WI   Wisconsin        55   WIS    9  
48   WY   Wyoming          56   WYO  10  
49   NA   Not Used         99   NA     0  
50   AK   Alaska             2   ALAS   9  
51   HI   Hawaii           15   HAW    1  
66   PR   Puerto Rico      99   PUER   7  
67   VI   Virgin Islands   99   VIRG   0  
91   PI   Pacific Islands  99           0  
 

99 ON LAST THREE ENTRIES MEANS NOT SELECTABLE FIPS (PR,72; VI,74)
1-48 NCDC NUMBERS ARE SUPPORTED WITH MONTHLY TIME SERIES (CIRS, AKA TD-9640)COMMENCING 189501

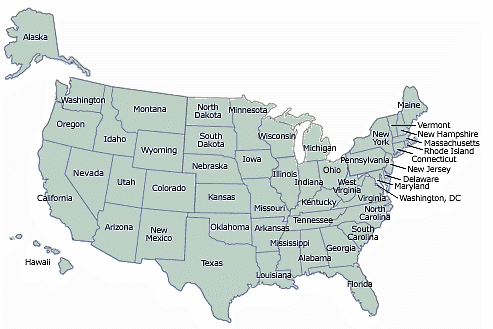
The following green US state map is available courtesy US Government Census Bureau.  Then courtesy of NOAA's Climate Data Center (CDC), the following GIF map may help individual climate division location:

Monthly Data Updates:

NCDC final data        December 2010          (201012)
NCDC preliminary data  December 2010          (201012)
CPC preliminary data   May 2011               (201105)
Please open or download these .TXT files to update your data and charts:

  201105precipitation (384kb, 49pages)   201105temperature (384kb, 49 pages)

###ALERT:  EFFECTIVE MARCH 2007 NCDC-CIRS DATA ADOPTED AN ADDITIONAL DIGIT VARIABLE FORMAT. Spatial and climate identifiers beginning in leftmost column 1 changed from StCdVyyyy to StCdVVyyyy.  This format change is readily compensated for manually while importing .TXT files into a spreadsheet such as MSExcel.  However, if you're reading this text (ASCII) file into another processing program such as Fortran, C++, etc. then almost all your input READ files formats will need to be changed accordingly.  Beginning with the 5th column first variable (V to VV), then yyyy, and then all the climate variable (e.g. temperature or precipitation) data fields have been shifted one (1) digit to the right in a tabular, ASCII format.
200702 and previous format:
481012007  0.46   0.17  -9.99 -9.99  -9.99 -9.99  -9.99 -9.99  -9.99 -9.99  -9.99 -9.99
200703 commenced format:
4810 12007   .50    .17   1.47  -9.99 -9.99  -9.99 -9.99  -9.99 -9.99  -9.99 -9.99  -9.99
END ALERT###

Examples:

Illinois 2003 precipitation, climate division 6, would be left headered by 110612003 where 11 is Illinois (IL), 06 is NCDC climate division #6 and precipitation is climate variable 1, followed by CY 2003. The twelve columns to the right of the indicator set are the monthly precipitation values (January = 1, February = 2, etc).  Monthly accumulated precipitation is in inches, with missing data indicated by -9.99. September 2003 (200309) is then 2.60 inches.

11 612003  0.58   1.88  2.55   3.63  4.94   7.15  4.38   5.34  2.60 -9.99  -9.99 -9.99

North Dakota 2003 monthly mean temperature for climate division 4, is indicated by the first nine digits on the left: 320422003 where 32 is North Dakota (ND), 04 is NCDC climate division #4, temperature is climate variable 2, followed by CY 2003.  Monthly mean temperature (simple average of the daily midpoints during the month) in degrees Fahrenheit (F) for September 2003 (200309) is then 59.70 F.  Missing data indicator is -99.90 or -99.9.

32 422003  12.90 10.90  22.80 45.70  54.50 61.70  72.20 74.60  59.70 -99.90 -99.90 -99.9


[DP Home] [ATLAS] [What's New] [Services] [About] [Predictions] [Archives] [Support] [Feedback] [Links] [Disclaimer]